When you
invest in the stock market, you need to look out for the best
stocks to make the maximum gains on your investments. Stock trading requires knowledge of analyzing
stocks and their profit-generating potential. One such method of analysis is a technical analysis that helps assess the stock’s future price movements based on historical patterns. Here’s a brief look into the concept of technical analysis:
What is technical analysis?
Technical analysis is the statistical analysis of the performance of a stock. The analysis is done using the historical performance of the stock based on the movements in price and trading volumes.
Technical analysis is different from
fundamental analysis as it uses historical and statistical data to predict stock price movements.
Technical analysis can be done using different types of charts and patterns. One such common tool of technical analysis is
candlesticks and
candlestick patterns. Let’s understand these tools in details:
What are candlesticks?
Designed by a Japanese rice trader named Homma,
candlesticks were drawn in the 1700s to represent the price movement of rice on a particular trading day. Later on, these
candlesticks were adapted to depict the price movement of
stocks.
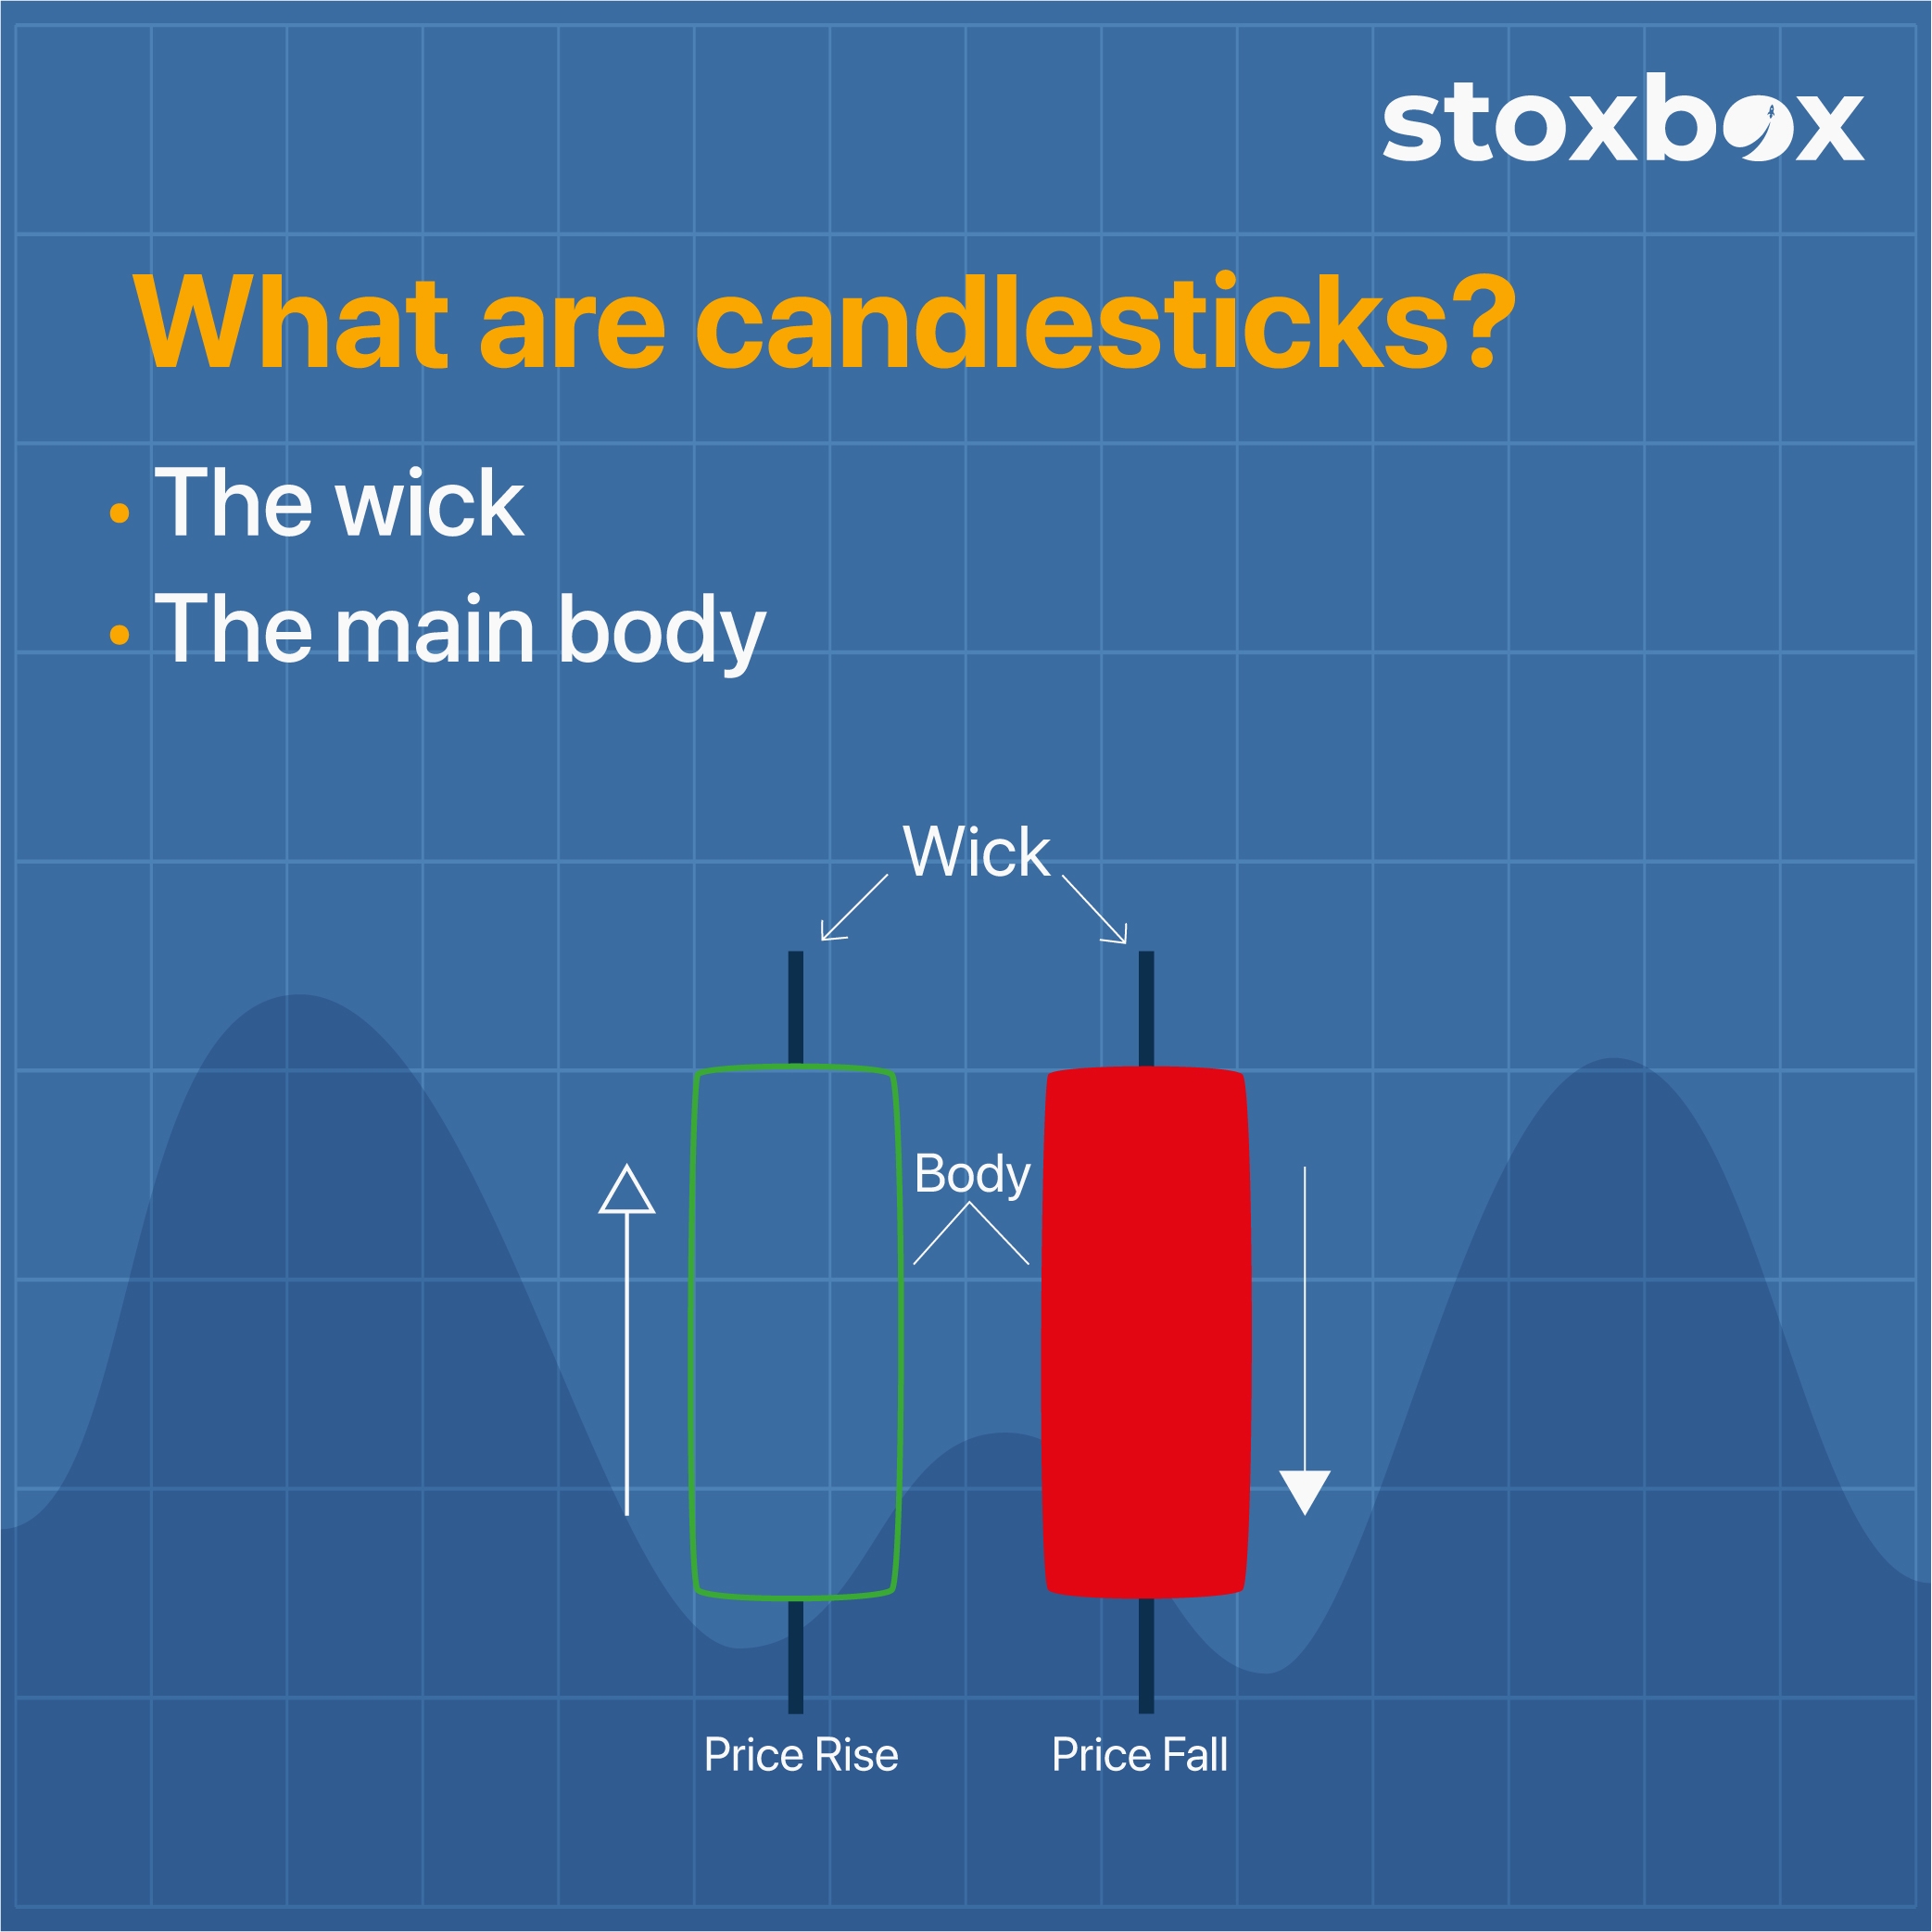
Candlesticks consist of two parts, the wick and the main body. Each part of the
candlestick represents a particular type of data. The anatomy of a
candlestick is explained below:
Beginner Guide 2022 Candlesticks Patterns
Also called
candlestick shadows, the wicks are thin lines emanating from the
candlestick’s body. They represent the highest and the lowest price of a stock in a given period. The length of the wick shows the range of movement of the stock price.
Beginner Guide 2021 Candlesticks Patterns
The candlestick’s main body depicts the range between the opening price and the closing price of the stock. One end of the body shows the opening price, and the other shows the closing price. The length depicts the range of movement between these two prices.
Beginner Guide 2021 Candlesticks Patterns
Here’s how
candlesticks usually look:
(Source:
https://www.kotaksecurities.com/blog/d-street/a-dummies-guide-to-candlestick-charts.html)
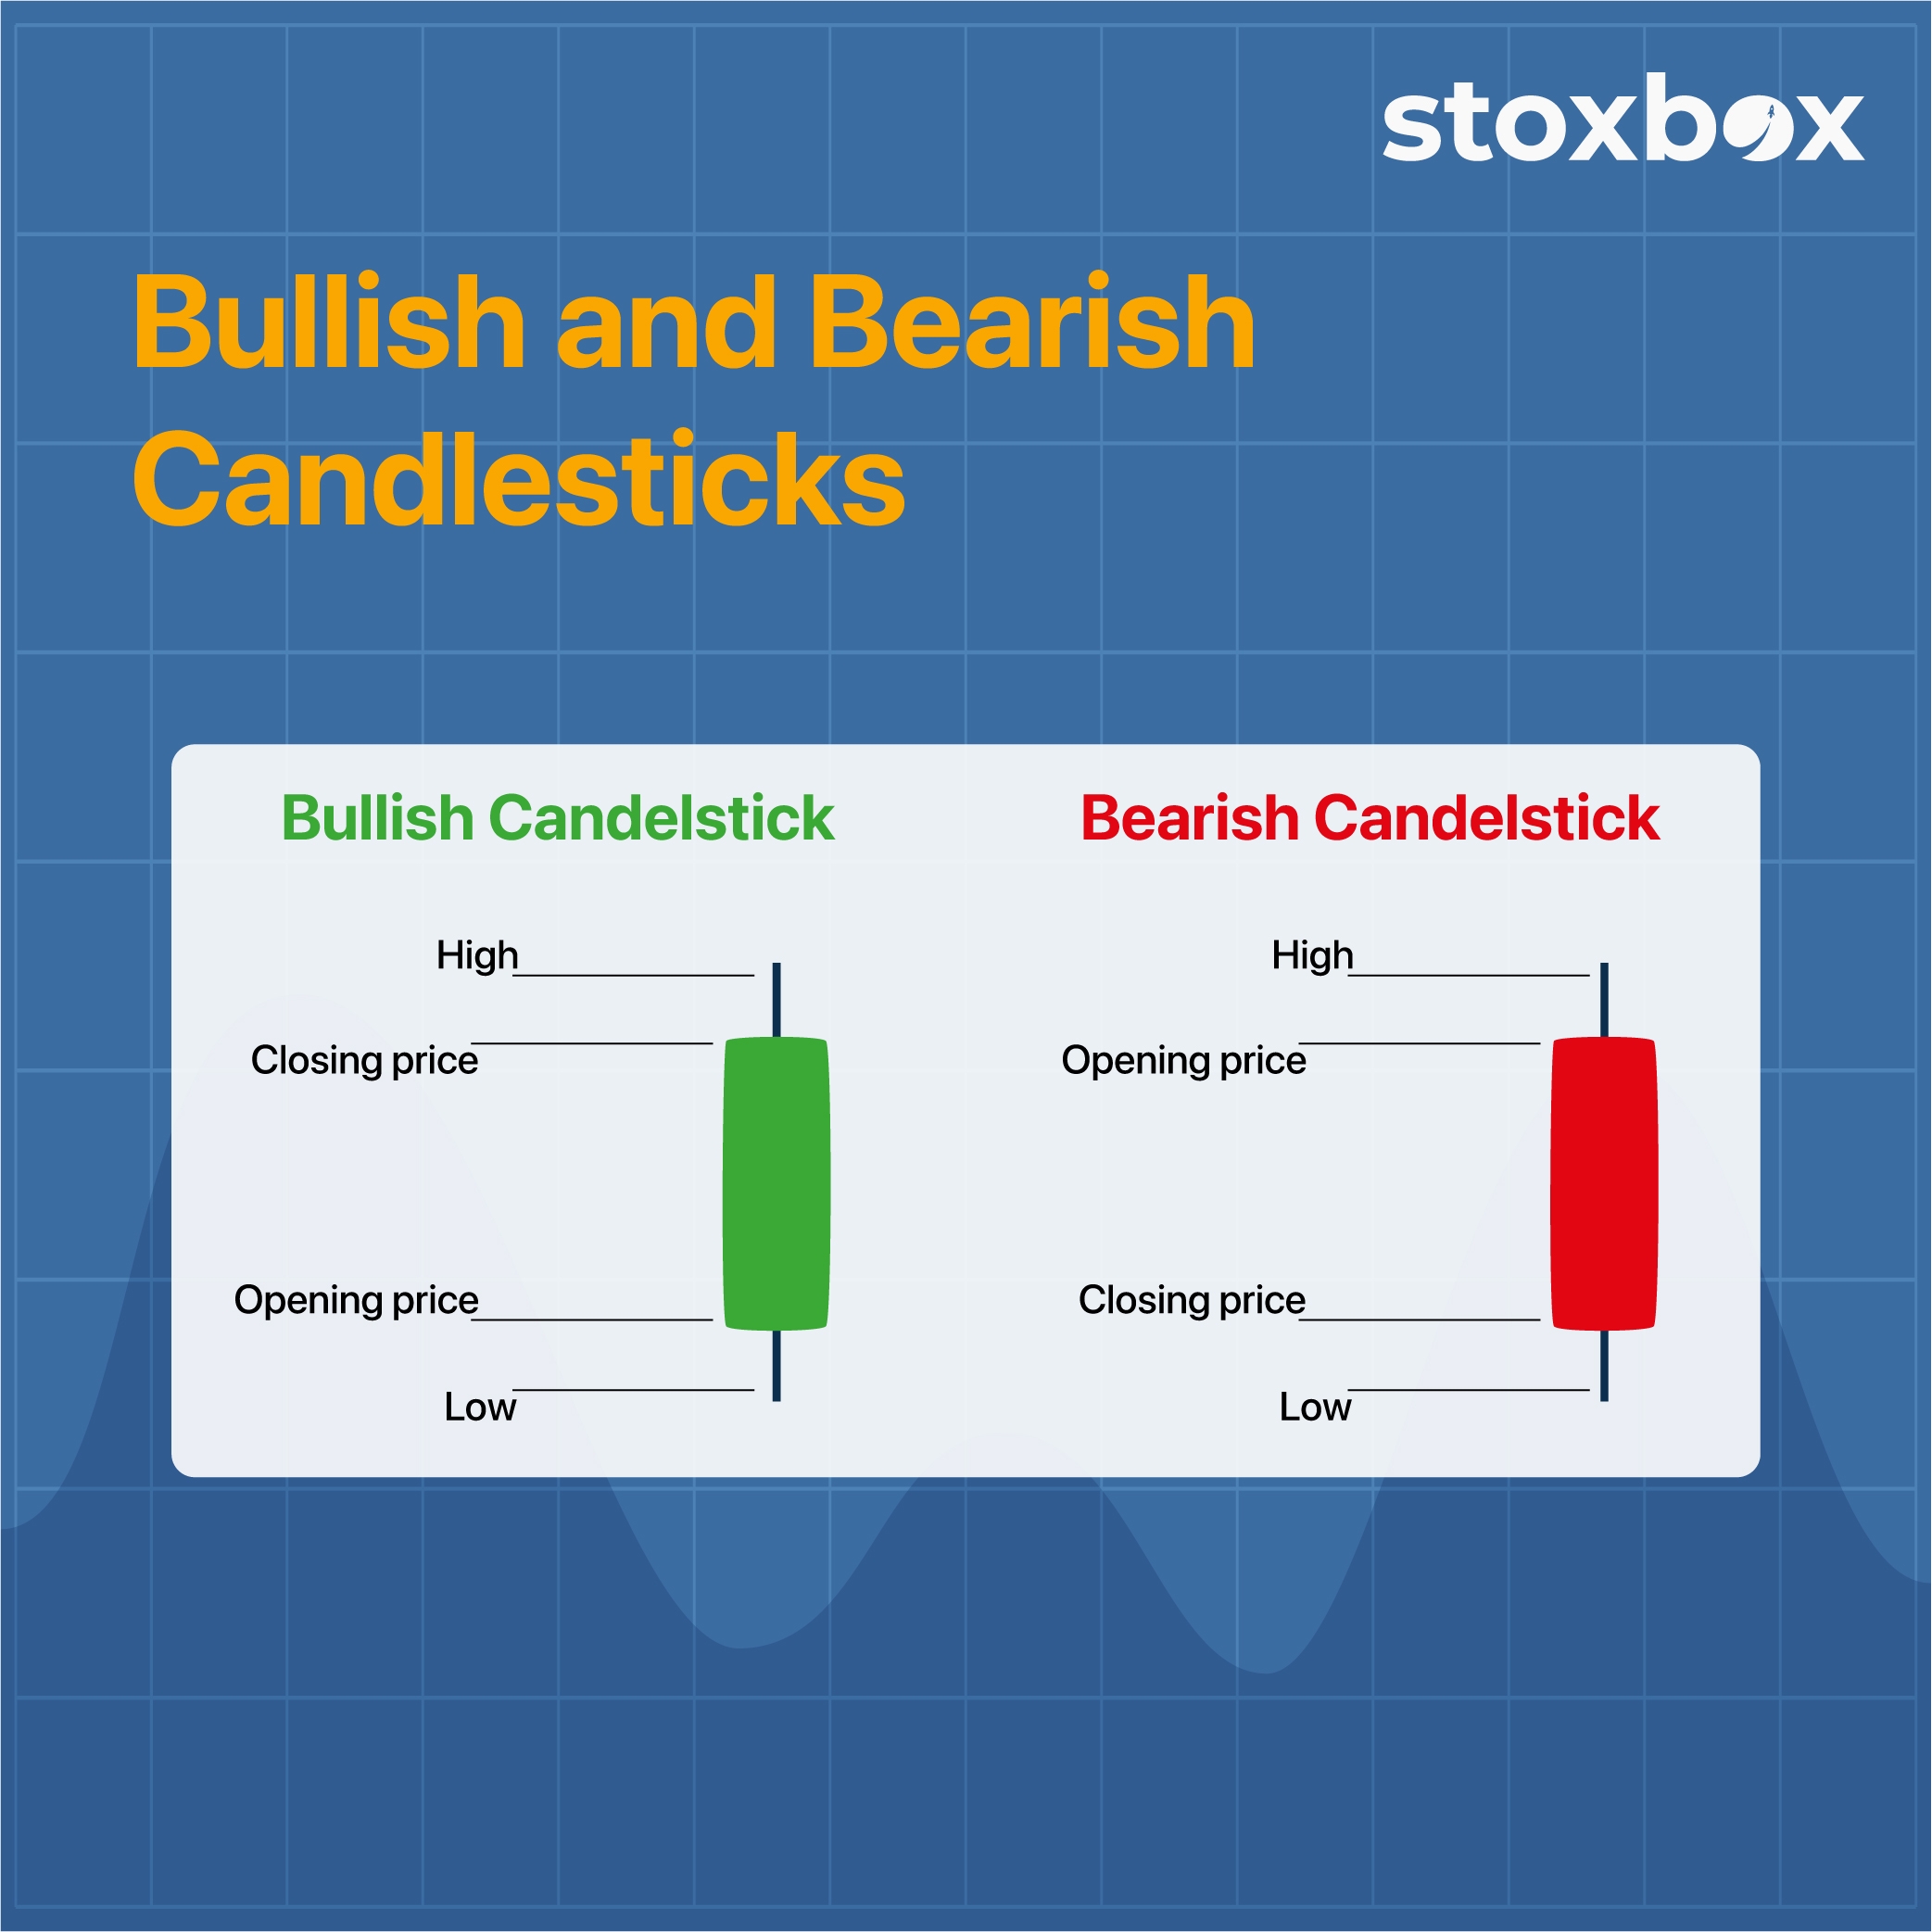
Bullish and bearish candlesticks
Different
candlesticks are drawn for different kinds of market movements. Bullish
candlesticks represent increasing prices of stock, while bearish
candlesticks show decreasing or reducing prices of the stock. Bullish
candlesticks are usually green or white. Bearish
candlesticks, on the other hand, are either red or black. Have a look:
(Source:
https://www.benzinga.com/money/how-to-read-candlestick-charts/)
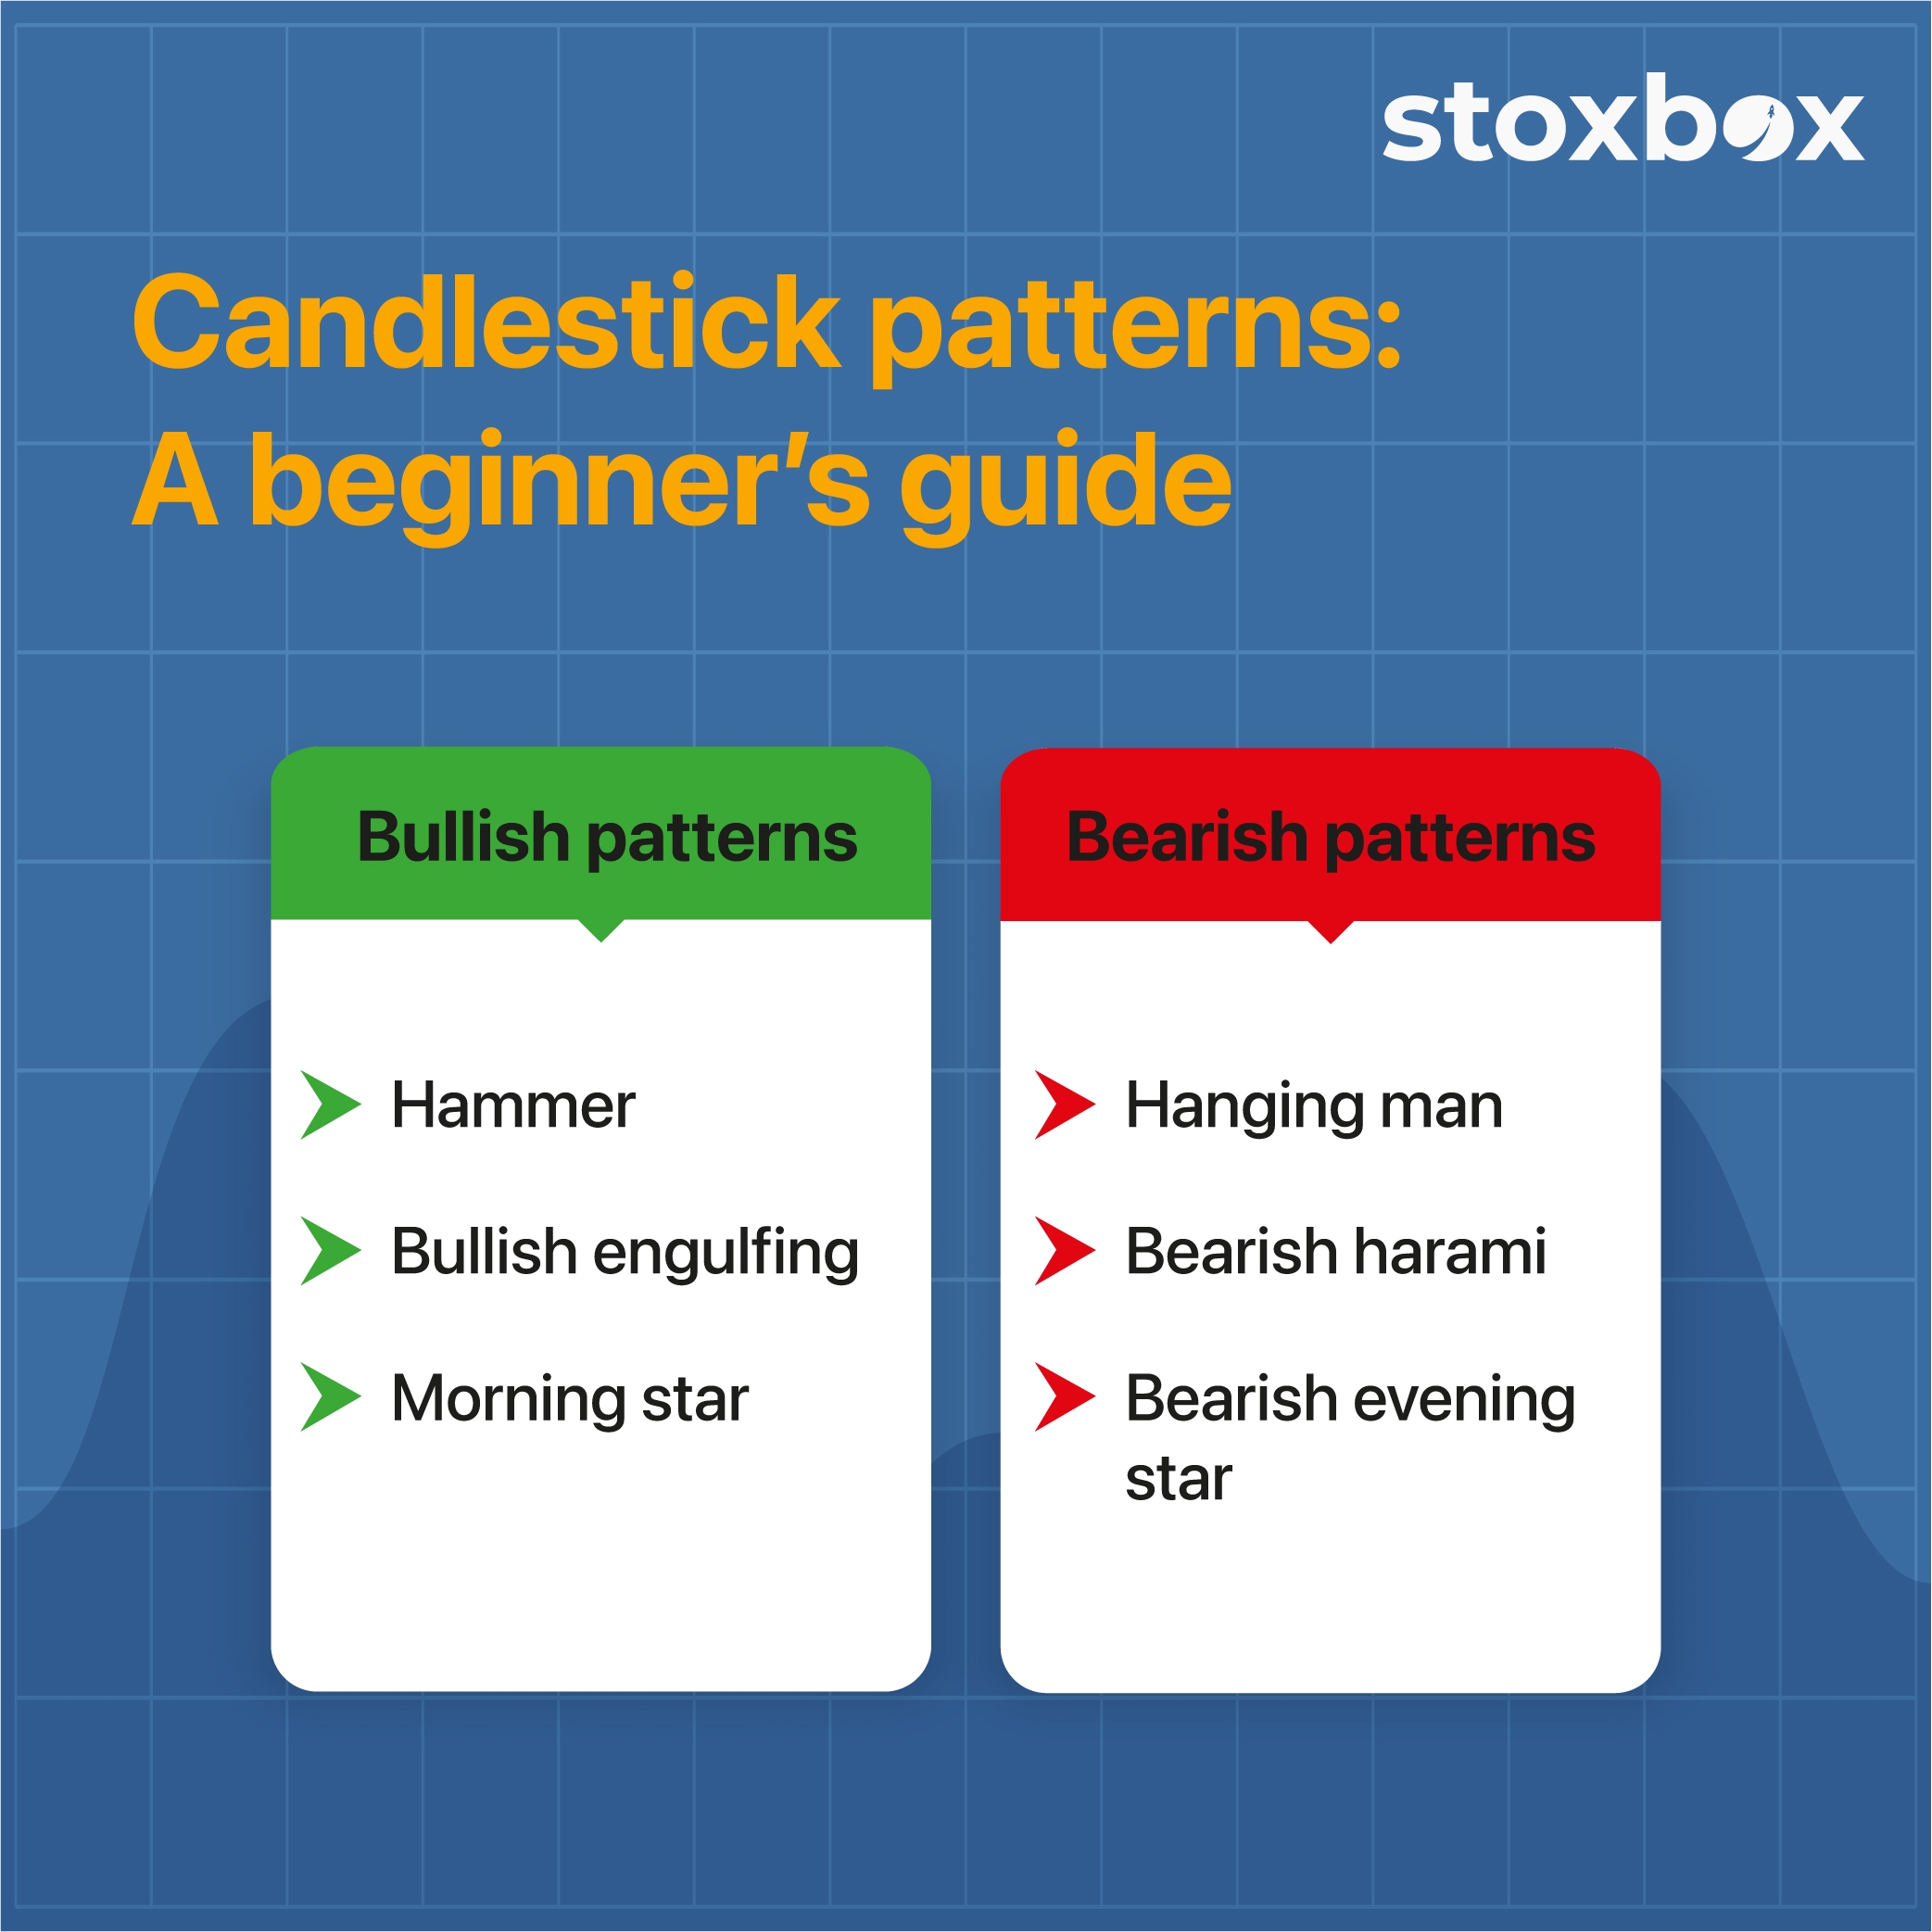
Candlestick patterns: A beginner’s guide
What is Technical Analysis Beginner Bullish Bearish Patterns
The price movement of
stocks creates specific patterns which, when represented on
candlesticks, become
candlestick patterns. These patterns help to assess whether the stock price is expected to increase or decrease. By studying
candlestick patterns, you can make trading decisions.
Candlestick patterns are of two types—bullish patterns and bearish patterns. Bullish patterns indicate a rise in prices, while bearish patterns indicate the opposite, i.e., a drop in the stock price.
While there are hundreds of
candlestick patterns, some of the most popular and commonly used ones include the following:
Bullish patterns
Hammer
The bullish hammer has a short body and a long wick at the bottom, which looks like a hammer. This pattern is usually found at the bottom of a downward market trend, and it shows that though the stock had a selling pressure, there was a strong buying pressure that drove the price up. Here’s how the hammer looks:
(Source:
https://www.dailyfx.com/education/candlestick-patterns/bullish-hammer.html)
Bullish engulfing
This pattern consists of two
candlesticks. The first one is a short red or bearish
candlestick, which is engulfed by the second, longer, bullish
candlestick. The pattern shows that though the stock was bearish initially, a strong buying pressure has driven the price up considerably. Here’s a depiction of the bullish engulfing pattern:
(Source:
https://www.dailyfx.com/education/candlestick-patterns/top-10.html)
Morning star
There are three
candlesticks in this pattern, and it is observed when a bearish trend is about to be reversed. The first
candlestick is a long, bearish
candlestick, and the second one is a small bullish one. The third one is a bullish
candlestick that is bigger than the second but smaller than the first. Moreover, the third candle should cover at least half of the body of the first one. Thus, the pattern shows that the downward trend is about to end, and a bullish run is expected.
(Source:
https://www.dailyfx.com/education/candlestick-patterns/top-10.html)
Bearish patterns
Hanging man
Like the hammer pattern, this
candlestick has a red or black color indicating that it is a bearish
candlestick. It usually appears at the end of a bullish run showing that there was a high selling pressure. This suggests that bulls might be losing control of the market, and the stock might start losing value.
(Source:
https://www.ig.com/en/trading-strategies/16-candlestick-patterns-every-trader-should-know-180615)
Bearish harami
‘Harami’ is Japanese for ‘pregnant,’ and this pattern consists of two
candlesticks. The first is a large bullish
candlestick followed by a small-bodied bearish one. The bearish
candlestick is enclosed within the body of the first one. This pattern is found at the peak of an uptrend, indicating a reversal in the stock price trend.
(Source:
https://www.dailyfx.com/education/candlestick-patterns/top-10.html)
Bearish evening star
This is a three
candlestick pattern that signals a reversal from the bullish trend to a bearish one. In this pattern, a short bullish
candlestick is seen between the first long bullish
candlestick and the third long bearish
candlestick. It shows that the bull run is slowing down, and a bear run is setting in.
(Source:
https://www.ig.com/en/trading-strategies/16-candlestick-patterns-every-trader-should-know-180615)
Interpreting the candlestick patterns
If you want to invest your
money in the
stock market, try
to look out for these
candlestick patterns to understand expected market movements.
Stocks are not
safe investments. They are volatile. To successfully invest in stocks you need to study the volatility, and such a study can be done through
price patterns indicated in
candlestick charts. So, understand the
basics of the stock market before you invest in it.
To learn
where to invest money for
diversification, you can also use
Stoxbox.
Stoxbox gives you a combination of different
investment options in India, including stocks that are picked using technical and fundamental analysis. You can, therefore, expose your portfolio to different types of investments and maximize returns.
Be careful when trading in stocks. Know the
rules of trading in the stock market, use the
candlestick patterns to identify trading opportunities, and then invest for maximum gains.


 Traditionally, people have been wary of investing in the market because of a lack of knowledge and experience, a low risk appetite, and the fear of losing their savings. However, this is changing slowly and surely as a number of individuals are now participating in equities directly. While some of these investors may have a strong understanding of the market, many are dipping their toes in with the guidance of stock brokers. Stock brokers are experienced and professional traders who facilitate the buying and selling of stocks, on behalf of their investors, in return for a commission or fee. Stockbrokers like Akshay help you assess your investor personality and empower you to begin your trading journey in a guided manner, thus limiting risk and increasing the scope of potential returns. In addition to routine guidance on where to invest, they also offer you a platform and portal, allowing you to directly access the market and earn high returns.
 With the recent interest in trading and direct participation, India has seen an influx of stock brokers, both offline and online. However, when considering who is the best stock broker for beginners in India, the answer lies in your personal requirements. For Mohan, Akshay is the best stock broker for beginners in India as he has offered him guidance, advice, a trading platform, and thorough mentorship, in addition to providing access to regular research and data. You can choose from a variety of service providers and arrive at your definition of the best stock broker for beginners in India by considering the following aspects: